Failure Mode Effects Analysis (FMEA)
|
This section addresses the following questions:
|
The FMEA (Failure Mode Effects Analysis) was developed by NASA during the Apollo program. Through various phases of further development, the FMEA by application in the automotive and mechanical engineering industry and semiconductor and microelectronics industry has experienced considerably enhancement. These applications demonstrate the versatility of the method. The FMEA is thought to be the most commonly practised form of risk analysis.
The FMEA is a preventative method that provides a quantitative evaluation of faults and their potential causes in terms of
- Probability of occurrence (O)
- Severity of the failure (S)
- Probability of detection (D)
In the ICH Q9 Guideline, FMEA is described as follows:
"FMEA (see IEC 60812) provides for an evaluation of potential failure modes for processes and their likely effect on outcomes and/or product performance. Once failure modes are established, risk reduction can be used to eliminate, contain, reduce or control the potential failures. FMEA relies on product and process understanding. FMEA methodically breaks down the analysis of complex processes into manageable steps. It is a powerful tool for summarizing the important modes of failure, factors causing these failures and the likely effects of these failures."
The essence is that the execution of the FMEA builds on the understanding of the product and the process. This means that the FMEA cannot be carried out without the appropriate preparation (e.g. process descriptions).
1 Objectives and areas of application
The objectives of an FMEA are as follows:
- The preventive identification and evaluation of possible failures, their causes and consequences during the implementation phase of processes/facilities
- The preventive identification and evaluation of possible failures, their causes and consequences for potential changes to existing processes and/or facilities (ideally based on an existing FMEA from the implementation phase)
- Determination of risk minimising measures
- Prevention or reduction of possible failures
- Avoidance of potential costs arising from failures that are not identified until a later stage
- Increase in product quality
- Increase in process stability
- Creation of a broad process understanding among staff
From the above objectives, we can deduce that the FMEA is not generally compiled as an one-off procedure during the implementation of processes and/or facilities, but that the FMEA has to be constantly adjusted when changes are made to processes/facilities, and in case of such changes the FMEA can also act as the basis for risk evaluation.
An FMEA can be applied or triggered in the following areas:
- New process
- Process changes
- New product
- Product changes
- New facility
- Changes to a facility
- Implementation of a new IT system
- Changes to IT systems
For all possible triggers, the FMEA should be executed at the earliest possible stage, since earlier implementation of the changes can still be relatively quick and cost-effective.
2 FMEA process
Figure 1 shows the FMEA process flow with six major phases:
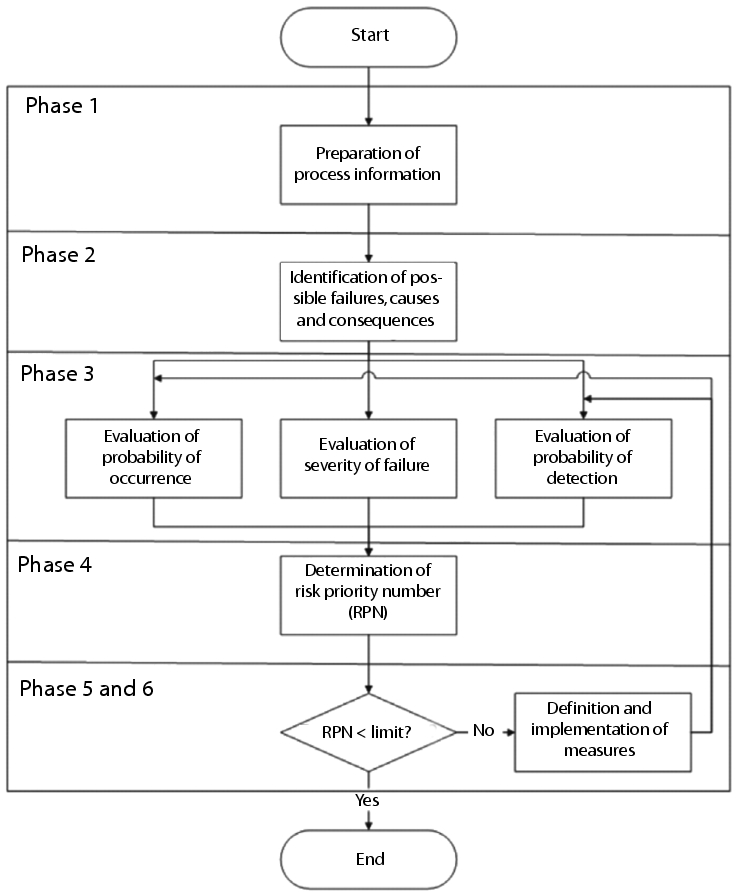 |
1. Preparation of the necessary process information
2. Identification of possible failures, consequences and cause of failure
3. Evaluation of the failure
4. Determination of the risk priority number (RPN)
5. Definition of measures
6. Implementation of measures
In the identification of failures, it is important not to concentrate on GMP-relevant failures only. In practice, it has shown to be more useful to include as many types of potential failure as possible (e.g. business risks, environmental risks, safety risks, etc.). Even if this initially means a greater documentation effort (which is not necessarily required for regulatory purposes), there are still advantages. For example, the potential risks for business-critical processes in accounting should also be identified, so that if necessary, measures can also be established to minimise non-GMP risks and thus make the processes more stable and reliable.
2.1 Preparation of the necessary process information
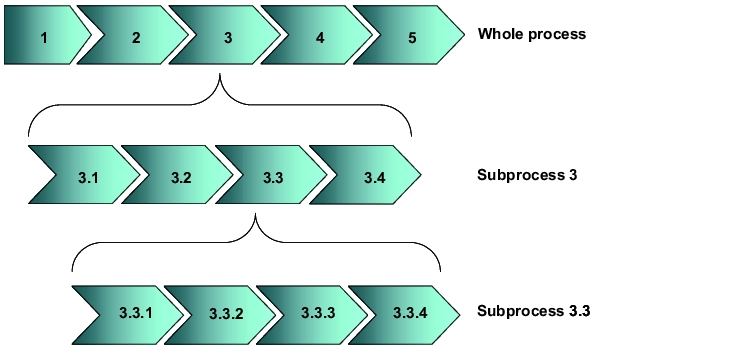
For the execution of an FMEA (and all other forms of risk analysis), all relevant process information must be available (examples of useful documents could be manufacturing reports or test specification). Initially, the respective overall process structure should be displayed and then subdivided (generally on multiple levels) into further detailed subprocessing steps. The description is mainly used to map the process to be analysed and its interfaces. Furthermore, structuring the processes on different levels enables classification according to level of detail and possible influence exerted.
These descriptions should ideally be executed in the form of process descriptions (e.g. flow charts as in figure 2) and may also be a part of the user requirements, e.g. when purchasing new facilities.
 |
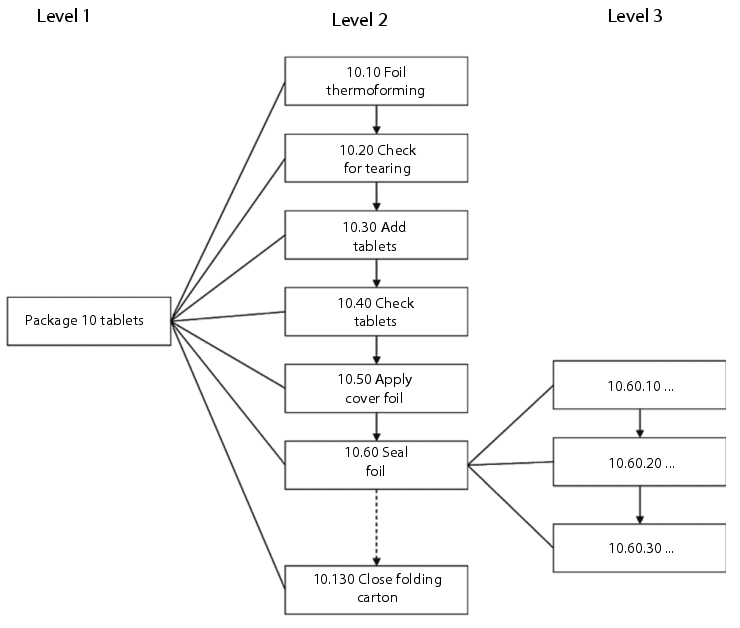
The individual process steps are assigned unique numbers to enable clear referencing at a later stage. In the example below (see figure 3), the steps have been numbered in increments of ten so that it is subsequently possible to insert additional subprocesses (e.g. if an extra control balance is integrated into the overall process at a later stage). Figure 3 provides an overview of a simple flow chart with three levels of detail.
 |
2.2 Identification of possible failures, consequences and
cause of failure
The identification of possible failures, their consequences, and causes of failure is the most time-consuming part of the FMEA. Each individual processing step is analysed at all levels for possible failures. All potential influencing factors must be taken into account (normally the five Ms, i.e. machinery, manpower, material, method, and milieu (environment); see chapter 10.D.2 Preparation using a fishbone diagram).
Failures that may seem hypothetical must also be taken into account, since the probability of occurrence is not considered until a later stage of the FMEA.
The identification of possible failures is time-consuming, particularly in the initial phase of the execution of FMEAs. When several similar processes/facilities have already been analysed, there may be similarities in the occurrence of failures, and the work required for this phase is reduced. In general, potential failures are identified by team members who actually implement the processes or work with the facilities. The team should be compiled from interdisciplinary members (e.g. from production, laboratory, quality assurance, engineering, information processing), but should also not consist of more than 6-8 participants to ensure that it can still function effectively. One suitable method for recording potential failures is, for example, brainstorming.
At this point of time it is important to take into account all relevant influencing factors and the requirements of the authorities. Authority regulations for which non-compliance can also be classified as a failure can be derived from the bodies of rules (e.g. EC-GMP Guideline, CFR). It is just as important, however, to consider the state of the art, since it is a regulatory requirement to take this into account in the design of technical systems. It is not always easy to determine the state of the art. The documents from the ISPE Baseline® series can provide some help. These documents describe how pharmaceutical production companies should design technical systems today. Since these documents are created by engineers and agreed with the FDA, they provide a good guide to the current state of the art.
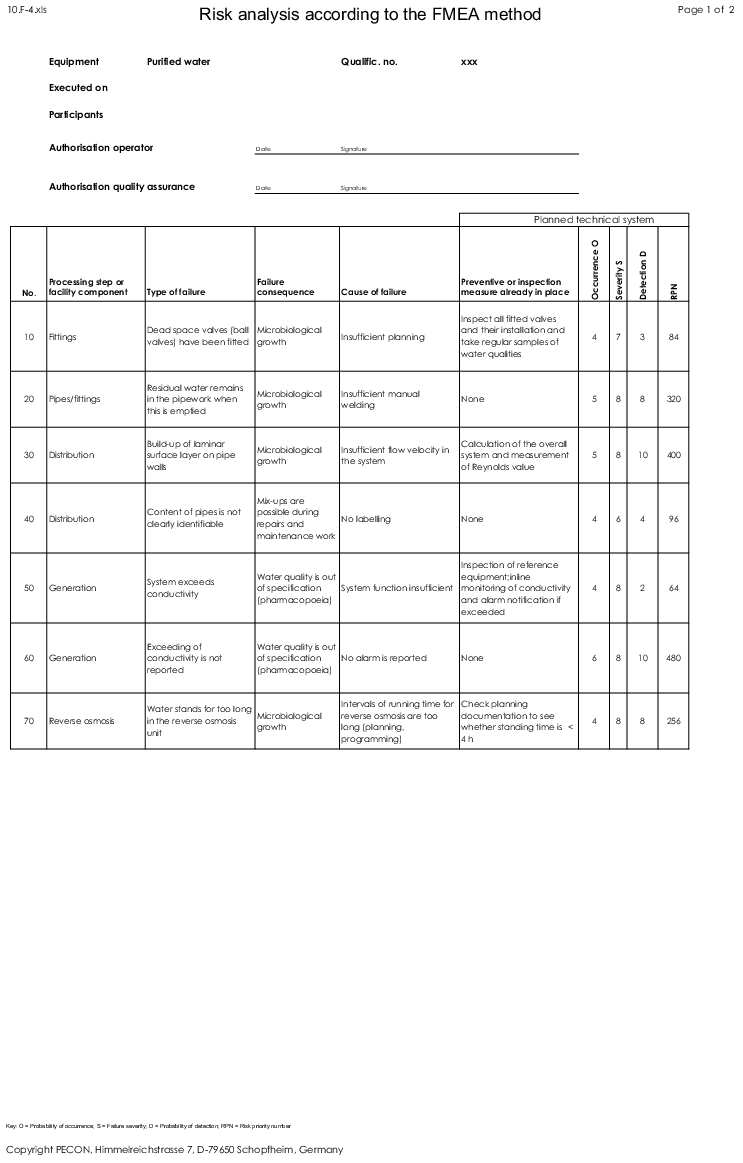
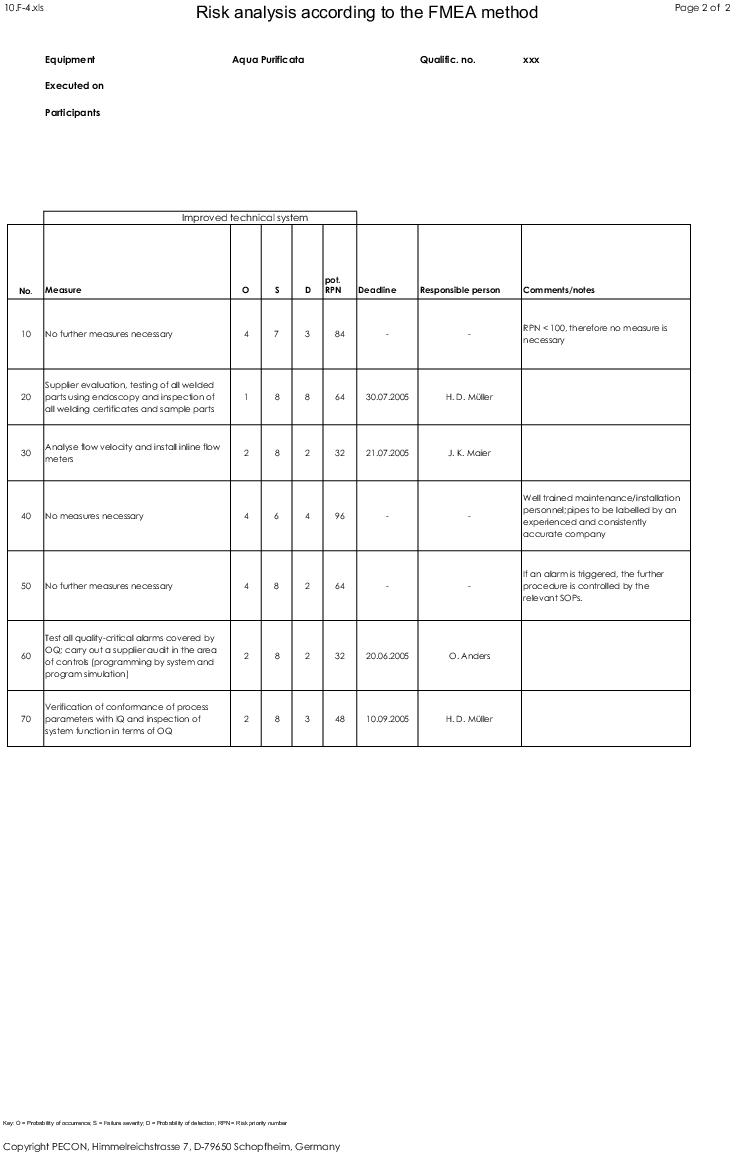
After documenting all potential failures and failure consequences and causes, they must be organised systematically. Many different causes of failure may often lead to the same failure, and the same failure may have several different consequences. This is documented in a form to ensure traceability (for an example, see figure 4) as well.
Note that while the planning of specific measures (in this example it is assumed that measures are only necessary if the RPN is ³100 - see chapter 2.3 Evaluation of the failures and chapter 2.4 Evaluation of the risk priority number (RPN)) can have a positive influence on the probability of occurrence and the probability of detection (and thus the potential RPN), the severity of the failure remains unchanged.
 |
 |
2.3 Evaluation of the failures
In the failure evaluation phase, as a general rule, only one line in the FMEA form is evaluated at a time. If, for example, several causes of failure are listed in separate lines that are linked to one failure, only these failures must be considered individually. However, if the different causes of a failure are summarised in one line, the causes of the failure are evaluated together.
In general, the following aspects of failures are evaluated:
- Probability of occurrence (O) of the cause of failure
- Severity (S) of the failure consequence
- Probability of detection (D) of the cause of failure
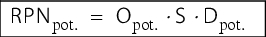
These three failure characteristics are assigned numerical values, which are used to calculate the risk priority number (RPN) by multiplying the three values together (see figure 5).
 |
|
O = Probability of occurrence, S = Severity, D = Probability of detection |
A modified FMEA is also possible, in which the three evaluation criteria O, S and D are assigned a non-numerical classification such as "low", "medium" and "high". chapter 6 Application example of a modified (simplified) FMEA provides an example of this.
It is essential that the three evaluations are performed independently of each other. For example, evaluation of the severity of a failure must not also include its probability of occurrence or detection. If the consequences of a failure lead, for example, to a S = 8, this number should not be reduced only because the failure only occurs once a year, for example.
The possible value ranges (scope of the possible numerical values) of the individual failure characteristics must be established specifically by the company. Recently, a certain standard has also developed within the pharmaceutical industry by which the values from 1-10 are permitted for each failure characteristic. However, it may be useful to restrict these value ranges for certain FMEAs (e.g. only permit values from 1-5). When determining the possible value ranges, it is always important to develop evaluation guidelines before an FMEA is executed, so that the significance of the individual numerical values is defined (e.g. what does a probability of occurrence of 3 mean? (example: "expected failure frequency ³0.05% and <0.1%") or a probability of detection of 6 (example: "The failure will probably be discovered (100% visual control is in place)").
Probability of occurrence (O)
For a risk, it is of high importance to determine how often a failure occurs or can occur. The more frequently a failure occurs, the higher the risk. This means, for example, that O = 1 might stand for a rare occurrence and O = 10 a very frequent occurrence. The probability of occurrence is generally determined by the cause of failure.
Figure 6 shows an example of an evaluation guide for the probability of occurrence.
|
Evaluation guide for probability of occurrence |
||
|---|---|---|
|
Evaluation |
Classification |
Explanation |
|
1 |
- |
Failure frequency <0.01% |
|
2 |
Low |
Expected failure frequency ³0.01% and <0.05% |
|
3 |
Low |
Expected failure frequency ³0.05% and <0.1% |
|
4 |
Low |
Expected failure frequency ³0.1% and <0.2% |
|
5 |
Medium |
Expected failure frequency ³0.2% and <0.5% |
|
6 |
Medium |
Expected failure frequency ³0.5% and <1.0% |
|
7 |
Medium |
Expected failure frequency ³1.0% and <2.0% |
|
8 |
High |
Expected failure frequency ³2.0% and <5.0% |
|
9 |
High |
Expected failure frequency ³5.0% and <10.0% |
|
10 |
High |
Expected failure frequency ³10% |
In the example shown in figure 6, we can also directly see the problems that often occur when estimating probability of occurrence. In order to use this type of table, well-founded historical operating data must be available for a particular process or facility. If this historical operating data is not available, it can often be beneficial to reduce the level of detail by grouping together individual evaluations (see figure 7).
|
Modified evaluation guide for probability of occurrence |
||
|---|---|---|
|
Evaluation |
Classification |
Explanation |
|
3 |
Low |
It is very unlikely that the failure will occur. |
|
6 |
Medium |
It is assumed that the failure will occur occasionally. |
|
10 |
High |
It is assumed that the failure will occur frequently. |
If it is also not possible to classify the probability of occurrence in this general evaluation, since no historical operating data regarding the probability of occurrence is available, this should initially be graded O = 10 (worst case). As new information becomes available, this figure can be reduced again.
Failure severity (S)
The severity of a failure is an essential feature for this assessment. The severity of the failure is generally determined by the consequences of the failure. It should be clarified in advance whether the failure severity only affects the "end consumer" (patient), or whether the failure severity for the next "customer" should be considered (internally, e.g. the packaging area may be a customer of the tabletting area). The latter is usually the option since it increases the stability of the processes and minimises the business risks which should be preferred (e.g. as a result of unusable products that need to be destroyed). The numerical value increases from 1-10 with increasing severity (see figure 8).
|
Evaluation guide for failure severity |
||
|---|---|---|
|
Evaluation |
Classification |
Explanation |
|
1 |
- |
No adverse effects on product/process quality can be derived. The failure consequences are wholly insignificant. |
|
2 |
Low |
No adverse effects on product/process quality are expected. |
|
3 |
Low |
A usable product can be expected. The master batch record is fulfilled, although some deviations in the process exist. |
|
4 |
Low |
A usable product can be expected. The master batch record is fulfilled, although considerable deviations in the process exist. |
|
5 |
Medium |
The product only has limited usability (specification is borderline), process is stable. |
|
6 |
Medium |
The product only has limited usability (specification is borderline), slight deviations in the process exist. |
|
7 |
Medium |
The product only has limited usability (specification is borderline), process is unstable. |
|
8 |
High |
The product is unusable, damage to patient health must be eliminated. |
|
9 |
High |
The product is unusable, damage to patient health cannot be completely eliminated. |
|
10 |
High |
The product is unusable, damage to patient health is likely. |
When creating a guide for the evaluation of failure severity, it is useful to take into account the effects of a failure in terms of staff, the environment and possibly data integrity issues.
Probability of detection (D)
When determining risk, it is important to know whether a failure is detected or will be noticed from the customer or the pharmacist.
The better the failure can be detected, the lower the risk. The numerical value thus decreases from 10 to 1, the higher the probability of detection is. This would mean that D = 1 is a value that, for example, can only be achieved if a fully automatic 100% test is integrated in the process or production process flow. D = 10 means that a failure is not detected (see figure 9). The probability of detection is generally determined by the cause of failure.
|
Evaluation guide for probability of detection |
||
|---|---|---|
|
Evaluation |
Classification |
Explanation |
|
1 |
- |
The failure is detected in 100% of cases (automatic measuring/test system, 100% control, process is halted immediately when failure is detected). |
|
2 |
Low |
The failure is detected in 100% of cases (automatic measuring/test system, 100% control). |
|
3 |
Low |
The failure will most probably be detected (automatic measuring/test system, random sample control, process is automatically halted if failure is detected) |
|
4 |
Low |
The failure will most probably be detected (automatic measuring/test system, random sample control (> 20%)). |
|
5 |
Medium |
The failure will most probably be detected (manual 100% control (test system, test tools, etc. are in place)). |
|
6 |
Medium |
The failure will probably be detected (visual 100% control). |
|
7 |
Medium |
The failure can be detected (manual control (>20%) (test system, test tools, etc. are in place)). |
|
8 |
High |
The failure can be detected (visual control (> 20%)). |
|
9 |
High |
The failure can be spotted visually at random (sporadic visual test). |
|
10 |
High |
The failure is not detected (no control). |
When evaluating the probability of detection, the test measures in particular that are already planned or designed at the time the FMEA is executed must be taken into account. If this is the case, they must be documented in the FMEA form together with the evaluation.
For example, in a tablet packaging process, if the completeness and integrity of tablets in blisters is constantly monitored by a control camera, this should be included in the evaluation. In this example, the probability that empty blisters will be detected increases, (proper functioning of the camera must be proven during qualification of the equipment), and hence the risk priority number decreases.
2.4 Evaluation of the risk priority number (RPN)
The risk priority number RPN is calculated by multiplying the values O, S and D.
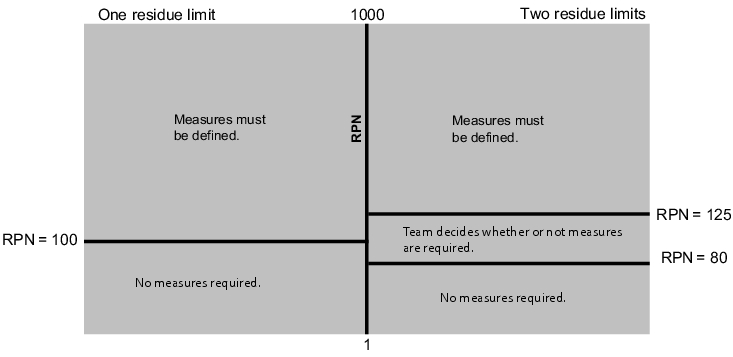
Using the evaluation numbers described above, this results in RPN between 1 and 1000. In addition to the RPN, the company's own risk tolerance is also highly significant. This is the level at which the company sets the limits for determining measures. The company needs to clarify which RPN represents the critical level above which risk-reducing measures need to be implemented. You need to establish whether this should be just one limit or more, for example, two (see figure 10).
 |
2.5 Measures
If the set limits are exceeded, the FMEA team needs to define measures that lead to a reduction of the RPN.
The top priority is assigned to measures for preventing or reducing the occurrence of the cause of failure. If this is not possible or not possible to a satisfactory level, suitable measures must be implemented to increase the probability of detection of the failure (e.g. through the use of electronic test systems).
All planned measures, including the planned implementation dates and responsibilities are documented in the FMEA form.
As a result of the planned measures, the RPN must be re-evaluated. This result is known as the potential RPN, meaning the RPN that can be expected on completion/implementation of the planned measures (see figure 11).
 |
|
RPNpot.: potential risk priority number, Opot.: potential probability of occurrence |
Some examples of suitable measures for reducing the probability of occurrence and increasing the probability of detection are listed below:
- Changes to facility in order to completely prevent the occurrence of the failure,
- Design redundant systems,
- Testing of certain functions during system qualification,
- Implementation of additional in-process controls,
- Staff training,
- Introduction of additional test points as part of preventative maintenance,
- Introduction of organisational regulations (standard operating procedures).
If the potential RPN is, even after definition of measures, still higher than the set limit, a decision is required at this stage, while involving the management, on whether the process or facility should be implemented or retained with the remaining risk.
Within larger projects, individual measures may often need to be adapted and re-evaluated. In these cases, the FMEA needs to be revised and new versions of the FMEA prepared.
In order to guarantee that the planned measures will be implemented, a designated member of the FMEA team should control/monitor the deadlines and implementation of all measures.
3 Further parameters for assessment of the overall process
Additional parameters that can be derived from an FMEA include the average RPN and the overall potential of a process.
The average RPN (see figure 12) is a parameter for evaluating the overall process. It can be used to provide a direct comparison between individual processes in terms of anticipated risks.
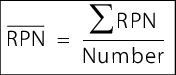 |
 to enlarge, click here!: average risk priority number  to enlarge, click here!: total of individual risk priority numbers to enlarge, click here!: total of individual risk priority numbersNumber: number of risk priority numbers available |
The overall potential (see figure 13) specifies the amount by which the average RPN is expected to be reduced after implementation of all planned measures.
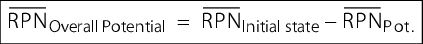 |
  : average risk priority number of initial state (without determining measures),  : average potential risk priority number |
4 Implementation of FMEA in the company
The implementation of a risk analysis in accordance with the FMEA method requires meticulous planning. Figure 14 shows an example checklist in which all important points for a successful implementation are listed in chronological order. The timeframe in which the individual points are to be processed is a project planning task for the implementation of an FMEA project.
|
Checklist for implementing FMEA in the company |
|
|---|---|
|
Step |
Comments |
|
Project start |
The management must actively support the implementation (in partic. providing the necessary capacities). |
|
Nomination of project manager |
The project manager must be granted the necessary authority (e.g. the required level of decision-making authority). |
|
Definition of project team |
The project team must include representatives from different disciplines (production, lab, quality assurance, engineering, information processing). Additional project members are nominated depending on requirement. |
|
Determination of application scope |
Should the FMEA only deal with GMP risks, or should, for example, business risks also be considered? Should the project cover both processes and facilities? |
|
Determination of classification |
Will the aspects O, S and D be assigned values from 1 to 10 or will a different system be used? |
|
Creation of evaluation guides for determining aspects O, S and D |
These evaluation guides are required to ensure that evaluations performed by different teams lead to relatively identical results (objectivisation of evaluation). |
|
Compilation of basic principles for risk assessment |
The availability of existing operational and authority requirements (under consideration of the state of the art) facilitates efficient processing of the FMEA. |
|
Determination of RPN limits |
Are one or two limits determined? How high are these? What happens if the limits are exceeded? |
|
Definition of the FMEA team |
After the FMEA has been implemented in the company, a team (or usually several teams) are set up to implement the method. |
|
Training of moderators |
At least one FMEA team member should be trained as a moderator. |
|
Training of FMEA team members |
The FMEA should be trained on the basis of examples. |
|
Execution of FMEAs in initial teams |
Experiences should be documented in great detail in the initial teams. |
|
Implementation of the measures decided upon |
The defined measures must be implemented, otherwise the risk assessment becomes pointless. |
|
Monitoring of measures |
The implementation of the measures also requires monitoring. |
5 Advantages and disadvantages of an FMEA
5.1 Advantages
The FMEA as a methodology offers many advantages which mean that the FMEA has ultimately prevailed in many industry sectors in preference to other methods of risk assessment. The advantages of an FMEA include the following:
- Quantitative evaluation of risks
- Ranking of risks is possible
- Qualification aspects are defined at an early stage
- Various levels of assessment are possible
- Interdisciplinary teams
- Traceability of decisions
- Evaluation guide for subsequent process/product/system changes
- Comprehensive method, also suitable for non-GMP risks
Quantitative evaluation of risks
The FMEA can provide a quantitative evaluation of risks. In the form displayed here, this results in a risk value (risk priority number, RPN) of between 1 and 1000, whereby the risk increases as the numerical value increases. The team or company itself can define at which level the tolerable risk and thus a limit is set (see figure 10). In general, this is a risk value between 80 and 125. The risk priority number (RPN) can be used to compare risks between processes, and also between different technical systems. This enables the available resources to be concentrated on the most risk-prone processes/systems and residual risk to be minimised.
Ranking of risks is possible
The determination of an RPN for each risk enables the creation of ranking lists. This can also considerably simplify the process of prioritisation. The decision regarding which aspects should be treated with priority is documented in a traceable form. For projects with a limited budget, this provides an efficient instrument for efficiently allocating available resources to critical risks.
Qualification aspects are defined at an early stage
Since the detection of failures (probability of detection) is an evaluation criterion within the FMEA, the test points IQ, OQ and PQ can be determined at a very early stage. This is of great benefit when planning resources for qualification.
Different levels of assessment
Depending on the progress of the project, the FMEA can be performed in more or less detail. This enables the critical processes/facilities to be classified at very early stage and then subjected to a more detailed assessment later in the process.
Interdisciplinary approach due to team members
The composition of the team who carries out the FMEA is a critical factor for the success of the FMEA. The cooperation of team members with different areas of knowledge (interdisciplinary team) enables the optimal result to be achieved. In order to ensure this, the team must work together towards the result, and the subsequent process owner (e.g. head of operation or laboratory), quality assurance, engineering and information processing departments must always be represented in the team.
Traceability of decisions
Each risk is evaluated and documented in the form in terms of probability of occurrence, severity of the failure and probability of detection, the route by which a particular risk assessment has been reached can subsequently be easily traced. When undergoing inspection by the authorities, it is also very easy to describe why some processes are considered in slightly less detail (or not at all) during the validation process while other processes have been assessed very intensively.
Evaluation guide for subsequent process/product/system changes
If, after the implementation of processes, products, systems, etc., these are subsequently changed, the FMEA created during the implementation can provide the ideal basis for the assessment of risk associated with the change process. The change itself should then also be evaluated in the FMEA. If applicable risk-minimising measures should be met and implemented.
Comprehensive method, also suitable for non-GMP risks
As explained in the previous sections, the FMEA is not only suitable for the evaluation of GMP risks. It can also be used for the evaluation of nearly all other types of risk (e.g. market supply risks, safety risks, environmental risks).
5.2 Disadvantages of an FMEA
In summary, the disadvantages of an FMEA include the following:
- Training is required before initial execution.
- The implementation takes time.
- The availability of resources must be guaranteed.
- The RPN offers only a limited level of objectivity.
However, the first three disadvantages above can be said to apply to almost all other methods of risk management, and should therefore not be used alone as a deciding factor for not implementing the FMEA methodology in a company.
Training requirements before execution
Before an FMEA is executed, participants must be trained in the application of the methodology. This is indispensable, since the persons involved will otherwise be working with different perspectives and prerequisites within the group. This can lead to endless discussions and dissatisfaction of team members during FMEA meetings.
The company should therefore hold an FMEA training course in which the team members are familiarised with the method and safety is improved for the execution of an FMEA. When all members of an FMEA team are aware of what they are trying to achieve, FMEA meetings can be executed more efficiently. A training course should last for between 0.5 and 1.5 days, depending on the existing level of knowledge.
In addition to the FMEA training courses, one member of an FMEA team should be trained as a moderator. During the meeting, the moderator has the task of guiding the team towards a result. This doesn't mean that the moderator comes up with the solution, but rather that he helps the team to achieve the objective. The moderator must therefore be able to know and explain the method very well, and must always keep the objective of the FMEA in his sights. In the case of disputes within the team, the moderator can often reach a consensus.
If the FMEA is documented by using a software program, the moderator should also be responsible for this task, so that the rest of the team members can concentrate on recording the risks, their evaluation, and risk-minimising measures.
Implementation takes time
The implementation of an FMEA in the company should not be rushed. Staff first have to familiarise themselves with the method and practice it over an extended period of time before they are able to form a realistic picture of the effectiveness of the method. This process requires time, which is generally in short supply within a company.
If the implementation phase is too short, this often leads to dissatisfaction on the part of executives and staff. The former are disappointed with the results and the latter are over-burdened with expectations. The implementation phase can be shorter if the staff and the teams are provided with appropriate support, e.g. in the form of coaching or training courses.
The availability of resources must be guaranteed
In order to execute FMEA meetings efficiently, all members must be able to participate in the discussion. If this is not possible, loss of efficiency will inevitably result and the outcome will suffer due to a lack of resource availability. The FMEA meetings must therefore be prepared on time and all team members must be aware of the priority.
Quasi-objectivity of the RPN
Since the RPN (risk priority number) is a numerical value, one could incorrectly assume that it represents an objective evaluation of the circumstances. The RPN is, however, only a measure of the degree of significance of a risk. It is not down to whether the RPN is 25 or 35, but more whether the value is 25 or 120. It is always important to remember that the RPN is the result of a subjective assessment by the team. The fact that the opinion forming process is converted to a numerical value does not make it any more objective, but still partially remains a subjective estimation. This "subjectivity factor" can be reduced with the help of evaluation guides (see chapter 2.3 Evaluation of the failures), which are designed to facilitate the objective assessment process.
However, the fact remains that different teams will always produce slightly different results. This fact must be known to all involved, in order to avoid misinterpretations.
6 Application example of a modified (simplified) FMEA
The following is a description of how a modified (simplified) FMEA can be executed. Here the three evaluation criteria of "probability of occurrence", "severity", and "probability of detection" are not assigned the numerical values from 1 to 10, but instead are assigned numerical values from 1 to 3 or "low", "medium", and "high". This can be useful if a more detailed classification of the evaluation criteria into numerical values from 1 to 10 is not possible or not practical, perhaps due to a lack of experience with the process.
It is important to remember, however, that reducing the possible evaluation levels does not always mean that the project team will come to an agreement more quickly on a particular grade. In fact, it is often more difficult to agree on one grade out of "low", "medium" or "high" than to find a compromise between "9" and "7", (e.g. 8), since the latter difference is perceived as less significant.
The following is an example of possibilities for implementing an FMEA in the risk analysis of a computerised system.
The severity of the failure (S) is assigned the following values:
- Low (1)
- Medium (2)
- High (3)
The probability of detection (D) is assigned the following values (in inverse sequence, since a low probability of detection increases the RPN more than a high probability of detection):
- Low (3)
- Medium (2)
- High (1)
It is also possible to represent the potential higher risk (to the product or to the patient) of GxP-relevant functions in the system by assigning the GxP risks a double weighting compared to the non-GxP risks (see figure 15, "GxP-relevant?" column).
|
Probability of detection |
|||||
|---|---|---|---|---|---|
|
Severity of the failure |
GxP-relevant? |
Factor |
Low (3) |
Medium (2) |
High (1) |
|
Low (1) |
No (1) |
1 |
3 |
2 |
1 |
|
Yes (2) |
2 |
6 |
4 |
2 |
|
|
Medium (2) |
No (1) |
2 |
6 |
4 |
2 |
|
Yes (2) |
4 |
12 |
8 |
4 |
|
|
High (3) |
No (1) |
3 |
9 |
6 |
3 |
|
Yes (2) |
6 |
18 |
12 |
6 |
|
The "factor" value results from multiplication of the "severity of the failure" value and the "GxP-relevant" value (No = 1; Yes = 2). The RPN then results from multiplying the probability of detection and the "factor". The probability of occurrence of a failure in the computerised system is taken into account when defining the test scope (see figure 17)
- GxP-relevant "No" (1)
- GxP-relevant "Yes" (2)
Figure 15 shows that in this example, a potential high severity of failure in GxP-relevant functions with a low probability of detection leads to an RPN of 18, while a potential medium severity of failure for non-GxP-relevant functions with a low probability of detection leads to an RPN of 6 respectively (etc.).
For the determination of measures (e.g. the required test scope for computerised systems), the determined RPNs (which may lie between 1 and 18) can be grouped into four risk categories (see figure 16).
|
RPN |
Risk category |
|---|---|
|
1-2 |
1 |
|
3-5 |
2 |
|
6-8 |
3 |
|
9-18 |
4 |
The evaluation of probability of detection (O) of a failure in a computerised system can be included, for example, by distinguishing between "standard functions" and "additional functions developed for the customer" (custom developments). This reflects the fact that failures occur significantly less frequently in standard functions than in custom developments, due to a wide distribution and greater experience with the standard functions. The test scope for custom developments should therefore be higher than for standard functions.
The assignment of risk categories shown in figure 17 for the required test scope demonstrates how a (modified) FMEA can be applied to control (and justifiably reduce) the required workload for computer validation.
|
Risk |
Standard functions |
Custom development |
|---|---|---|
|
1 |
No test required |
No test required |
|
2 |
No test required |
Test required for all requirements/functions in the OQ and PQ. Where reasonable, limits and negative tests should also be taken into account in the OQ. Reference to developement tests is permitted. |
|
3 |
Test required in the OQ and PQ for all requirements/functions. Where reasonable, limits and negative tests should also be taken into account in the OQ. |
Test required (in OQ and PQ) for all requirements/functions incl. limit and negative tests |
|
4 |
Test required in the OQ and PQ for all requirements/functions incl. limit and negative tests. |
Test required in OQ and PQ for all requirements/functions incl. limit and negative tests The whole process must successfully pass the PQ. |
|
Summary FMEA is one of the most common methods for performing a risk analysis. It is a preventive method, in which failures and their potential causes and consequences are quantitatively evaluated in terms of probability of occurrence, severity of the failure (degree of damage) and probability of detection. It is used during the implementation of new processes or facilities for the preventive identification and evaluation of possible failures and their causes and the definition of risk-minimising measures if applicable. It can also be applied to the preventive identification and evaluation of possible failures and their causes when changes are made to existing processes or facilities. Alltogether, this leads to higher process and product stability and hence the avoidance of costs (as a consequence of failure). For quantitative evaluation of risks, the three factors "Probability of occurrence (O)", "Severity of the failure (S)" and the "Probability of detection (D)" are usually assigned a value between 1 and 10. These values are then multiplied and the result is the risk priority number (RPN). The RPN can thus have a value of 1-1000 (if a scale of 1-10 is used). The company has to decide the RPN value above which measures for reducing the RPN, and hence the risk, must be introduced. These measures should have the effect that when the evaluation is carried out again, the RPN is below the limit (after execution of the measures). Based on the above standard procedure, modified FMEAs can also be carried out for specific areas of application (e.g. risk analysis of a computerised system). In this process, either the permitted values for the three factors (O, S and D) can be reduced (see chapter 6 Application example of a modified (simplified) FMEA ) or extended as necessary, or individual factors may also be completely omitted (e.g. if no statements on the probability of occurrence are possible). It is also possible to combine the two. The FMEA is therefore a very flexible method for execution of risk analysis. |
